GigSafe's HNOA Rates Survey Results
Oct 9, 2024
Fast Facts: 15 companies replied with driver fleets ranging from 7-345 in size.
How much does your HNOA cost (as % of driver earnings)?

Number of drivers paired with % of earnings answer:
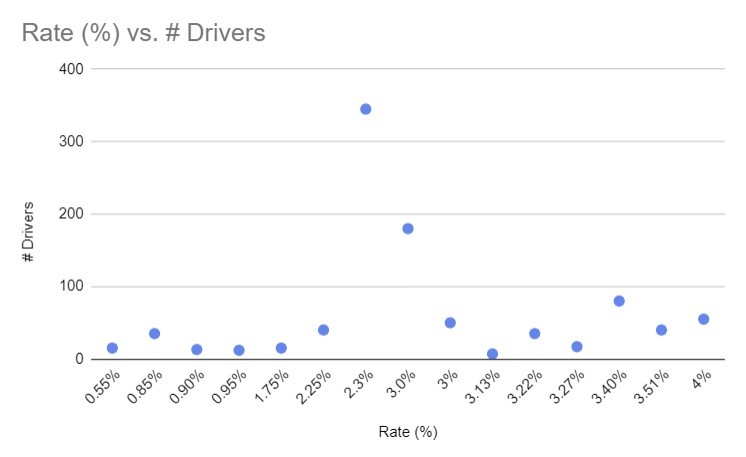
Key Observations:
1) Rates vary wildly - up to 8x. At first glance, this is quite surprising and might be symptomatic of the final mile insurance industry lacking transparency and competitiveness.
2) Lower rates aren’t correlated with a larger number of drivers, and once again this is genuinely surprising. If anything, having more drivers is negatively correlated with rates. This is bizarre since your intuition would suggest that larger companies would have more buying power and leverage to access lower rates. But that intuition would be wrong.
We’ll continue to expand and improve our survey, but there’s one question I wish we had added that I suspect would correlate nicely with the rate chart:
“When’s the last time you ran a competitive bidding process for your insurance?”
Anecdotally, this is what I’ve seen have the biggest impact on where a company ends up on that curve. Just the act of shopping around can keep a provider honest, let alone having a comparable, cheaper policy offer in hand.
Key Takeaway:
Mystery = Margin
Final Mile insurance has the telltale signs of an uncompetitive industry: few providers, non standard pricing, and high switching costs (in the form of difficulty obtaining alternative quotes).
So… when’s the last time you compared rates?
Jimmy@GigSafe
Download PDF Book